Analytics Graphs are one of the recent blocks in Moodle for visulizing extisting data like activity and results of the students. Analytics Graphs are primarily tools for ongoing courses so due to the students activity minor tweaks can be done on a realization.
When the course is finished collected data can be reviewed and see whether there were exercises that ended up being to difficult and need alteration on a next realization.
Analytics Graphs suits best for a course that has duration of two periods and the amount of activities is between six and twelve.
Analytics Graphs block is added like other blocks on a course. Turn on editing mode and click add a block link from bottom right hand corner.
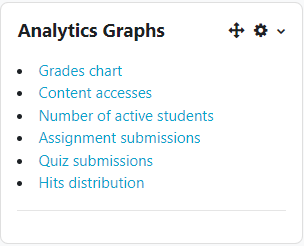
By default the block looks as follows
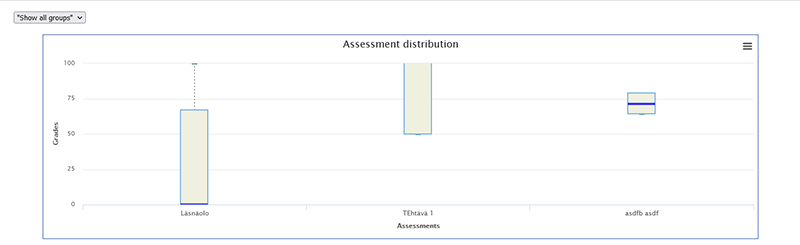
Assessment distribution graph describes the distribution of Assessments. Each activity with numeric scale works fine with this tool. Activity with Pass/Failed scale illustrates nothing sensible with this graph.
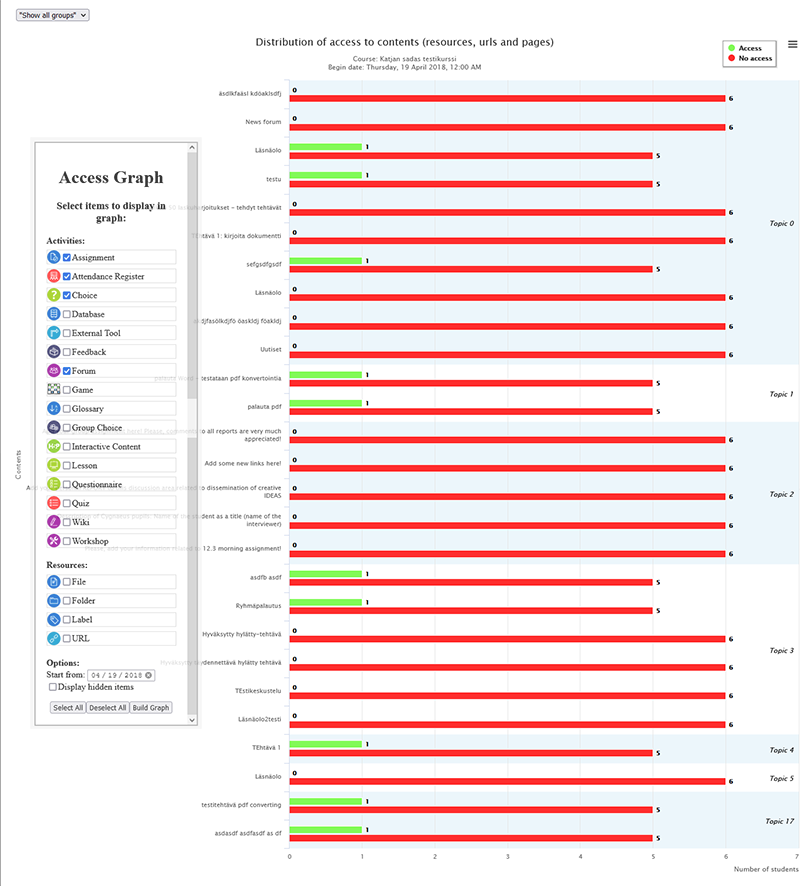
Distribution of access to contents display how students have opened activities. This helps you to track whether all the activities are opened and is there an activity that the students don’t take advantage of. You can choose what activities to include to the graph.
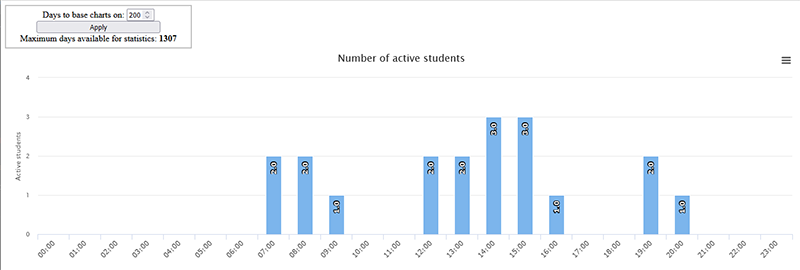
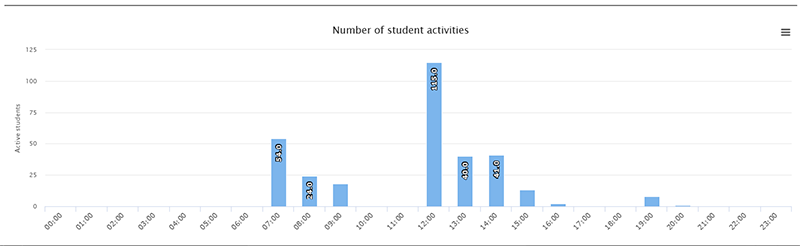
Number of active students and Number of student activites displays what hours are are busiest during the realization. Clicking the bars will provide more detailed information.
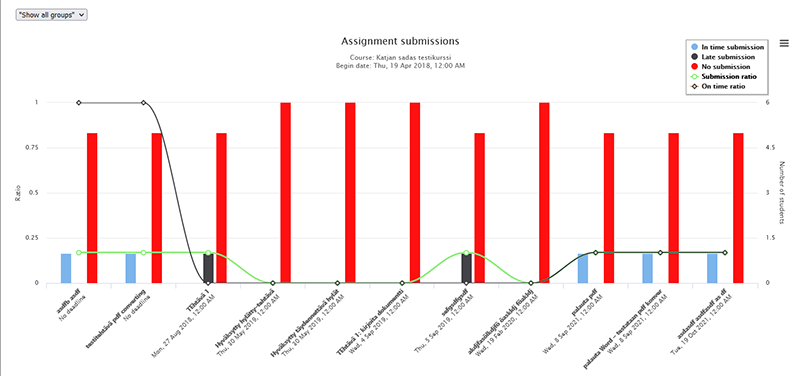
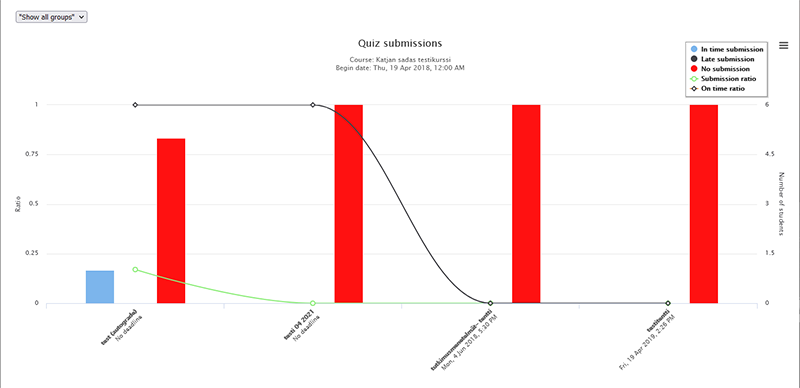
Assignment & Quiz submissions graphs displays the information over amounts of submissions. Good tool for tracking has every student completed certain activities.
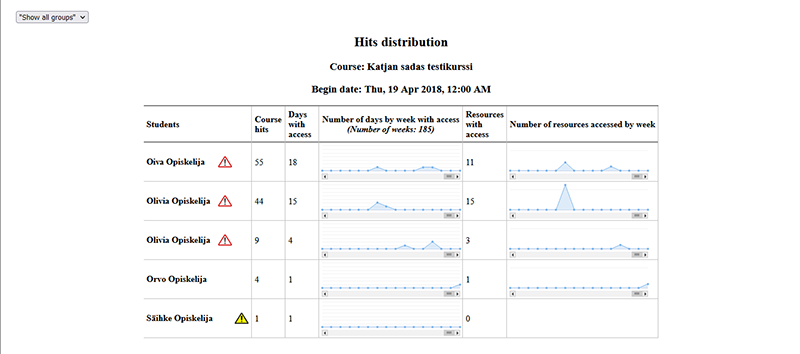
Hits Distribution graph displays general activity on a course sorted by students and offers possibility to send email to the students that have been inactive for a week or have never been active.